Nodal Analysis
Find the operating point of the complete well system.
Nodal Analysis runs One Flow several times and searches for the operating point where the reservoir inflow performance intersects the system outflow curve. This takes longer than running One Flow alone.
Video tutorial coming soon
A YouTube walkthrough will be embedded here.
1. Upload the File
- Select Home in the sidebar.
- Select Clear All Data to start from a clean model.
-
Select Upload File and choose the file saved in the previous tutorial, for example
model_well_tutorial_2part2_oneflow_YYYYMMDD.
2. Run Nodal Analysis
- Select Simulation in the sidebar.
- Select the Nodal Analysis tab.
- Select Run Nodal Analysis.
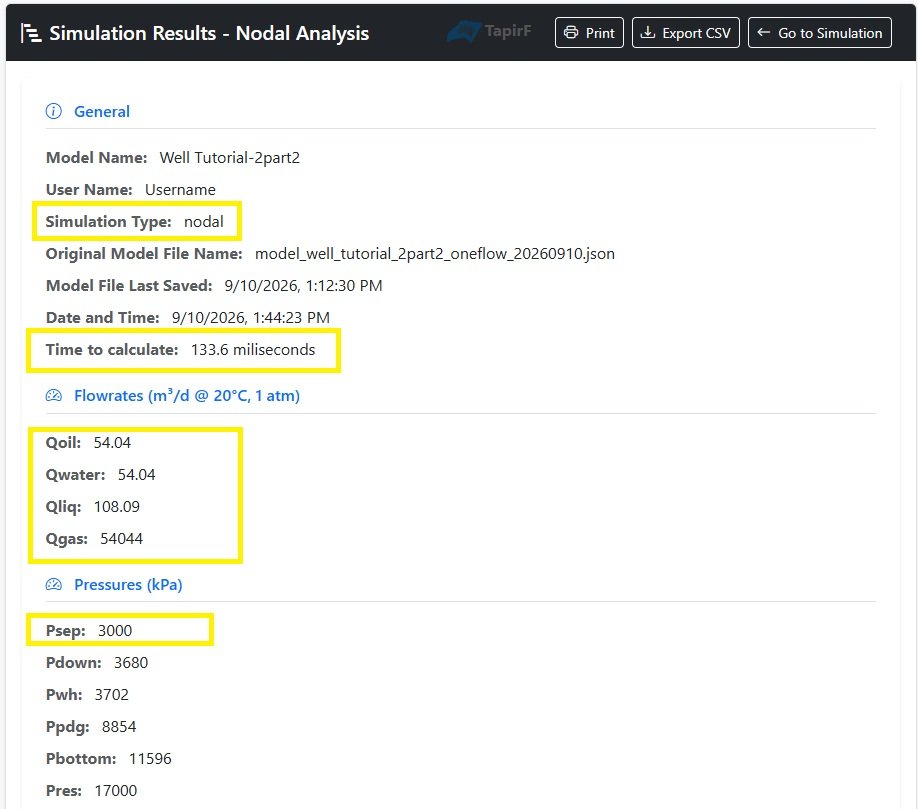
Review the results:
- The simulation type changes to nodal.
- The calculation takes longer than One Flow. In this example, it takes almost 0.14 seconds, while the previous simulations took less than 0.01 seconds.
- The flow rates decrease to 54 m³/d. This is expected because the separator pressure was set to 3000 kPa. With an oil flow rate of 65 m³/d, the previous run produced only 743 kPa at the separator. Therefore, the system must produce at a lower flow rate to satisfy the 3000 kPa constraint.
3. Review the Curve Crossing
Open the Curve Crossing plot and select Nodal at Surface.
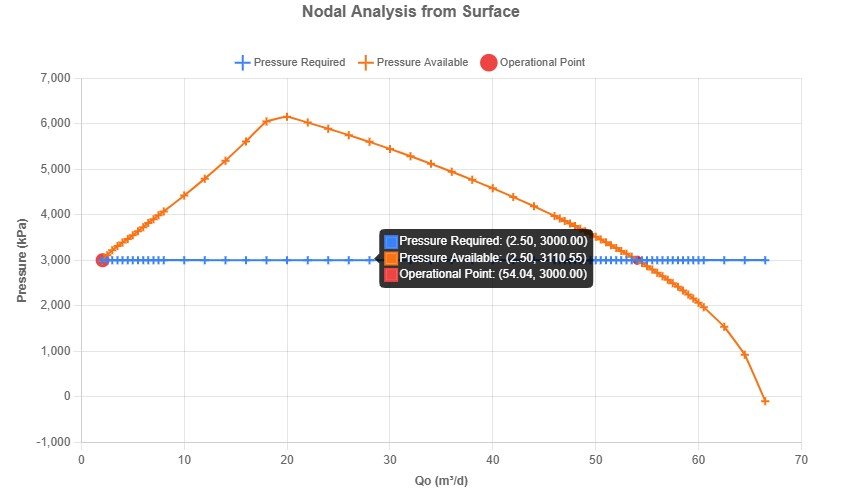
There are two crossings. The crossing with the higher flow rate is the stable one and is considered the valid operating point. In this example, the equilibrium oil flow rate is approximately 54 N m³/d.
4. Run Another Nodal Analysis Case
- Select Fluid in the sidebar.
- Enter GOR - Gas Oil Ratio. Use
200. - Select Simulation in the sidebar.
- Select the Nodal Analysis tab.
- Select Run Nodal Analysis.
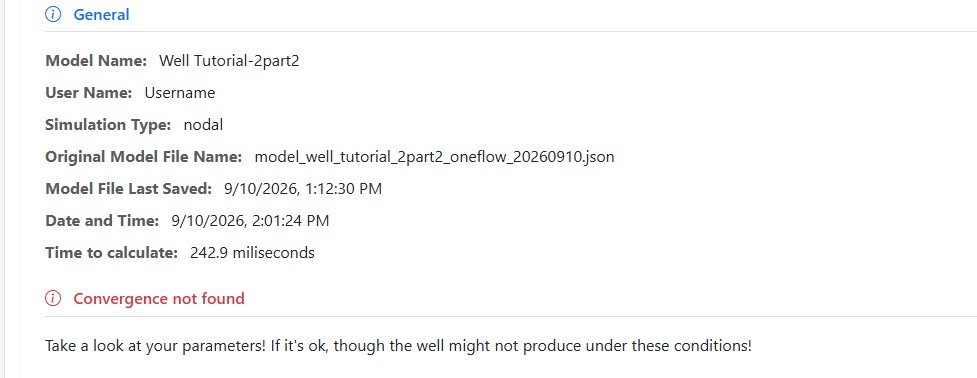
The simulation does not converge.
Open the Curve Crossing plot and select Nodal at Surface.
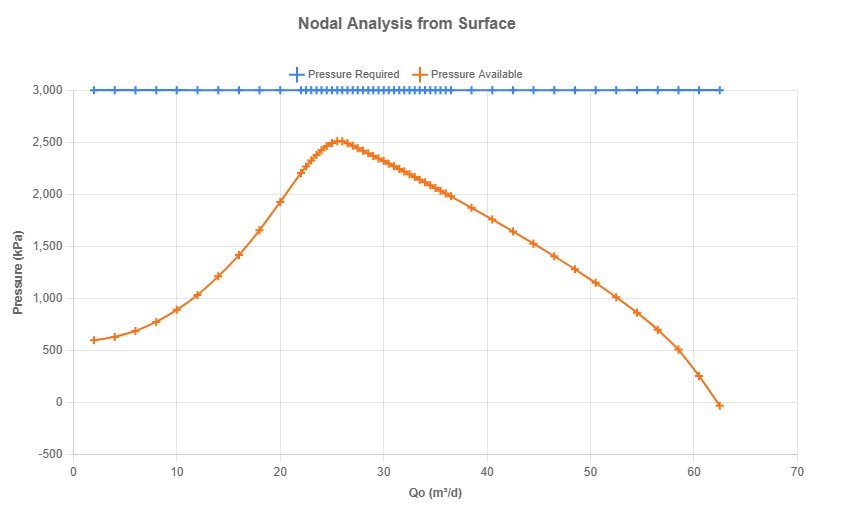
There is no curve crossing, which means no operating point was found. This demonstrates that, under the new lower-GOR condition, the well cannot flow to a system that requires 3000 kPa because the maximum available pressure at the end of the system is about 2509 kPa.
- Select Home in the sidebar.
- Enter Model Name. Use
Well Tutorial-3. - Enter Model Description. Keep
Tutorial to get used to TapirFlow.
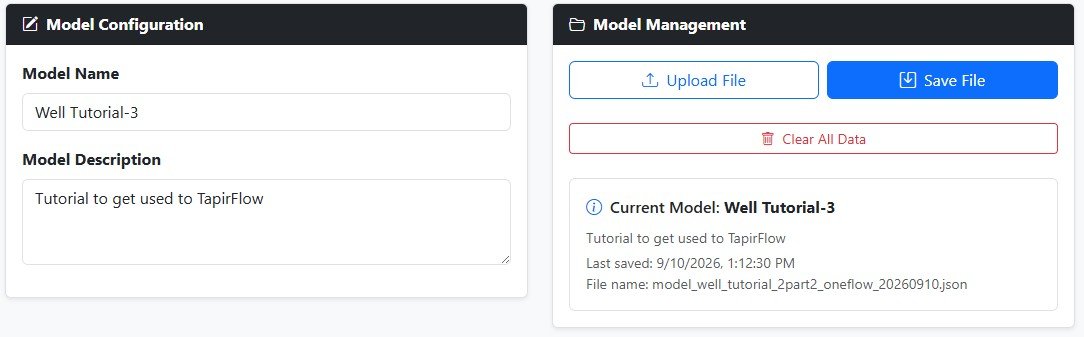
Select Save File. TapirFlow will save a file named
model_well_tutorial_3_nodal_YYYYMMDD. Move it to your Tutorials
folder.
5. Final Discussion and Exercise
Modify the system by reducing the downstream pressure. Set Sep Pressure to
1000.
Run Nodal Analysis again and open the plot to identify the new operating point.
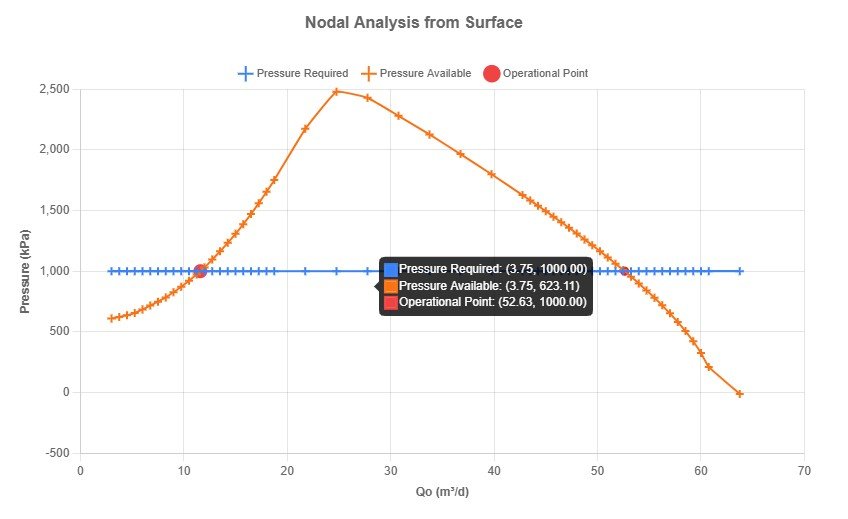
The oil flow rate increases from zero to approximately 52.6 N m³/d.
Sometimes, providing the well with a lower-discharge-pressure system is not feasible without significant plant investment — this is where artificial lift methods come into play.