Basic Simulation
Build a simple well model and run a One Flow simulation.
One Flow calculates the pressure drop from bottomhole to the surface for a specified flow rate and returns the pressure at the final node. In this tutorial, you will configure fluid, reservoir, and well data for a simple fictional system.
Video tutorial coming soon
A YouTube walkthrough will be embedded here.
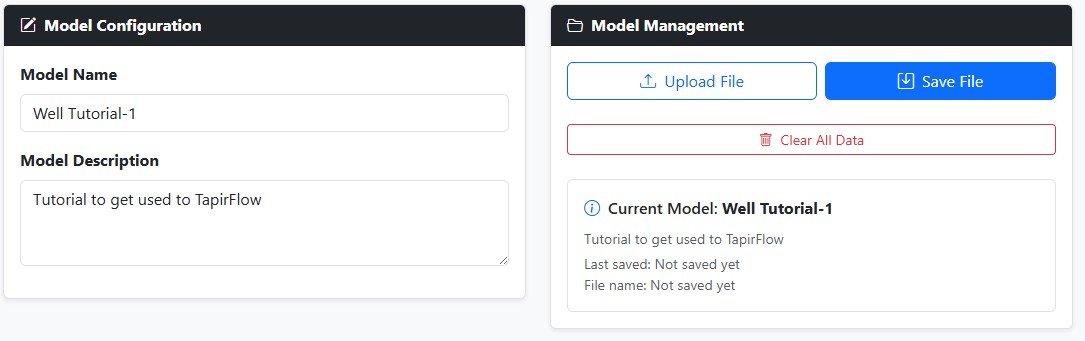
1. Home Page - Enter General Information
- Select Home in the sidebar.
- Select Clear All Data to start from a clean model.
- Enter Model Name. Use
Well Tutorial-1. - Enter Model Description. Use
Tutorial to get used to TapirFlow.
2. Fluid Page - Enter Fluid Properties
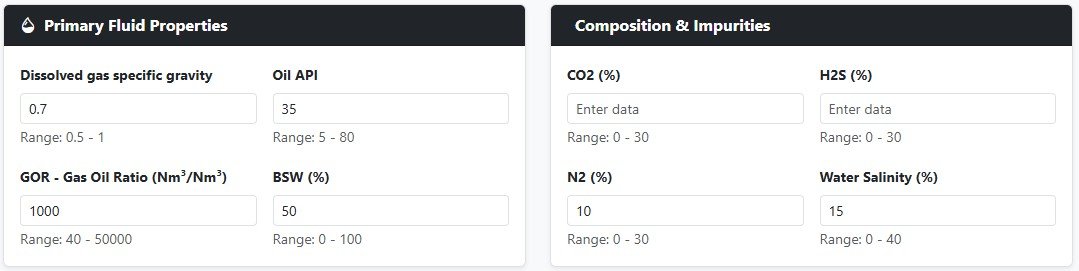
When you open the page, validation messages may appear because some required fields are empty. Enter the following values:
- Select Fluid in the sidebar.
- Enter Dissolved gas specific gravity. Use
0.7. - Enter Oil API. Use
35. - Enter GOR - Gas Oil Ratio. Use
1000. - Enter BSW. Use
50. - Enter N2. Use
10. - Enter Salinity. Use
15.
3. Reservoir Page - Enter Reservoir Properties
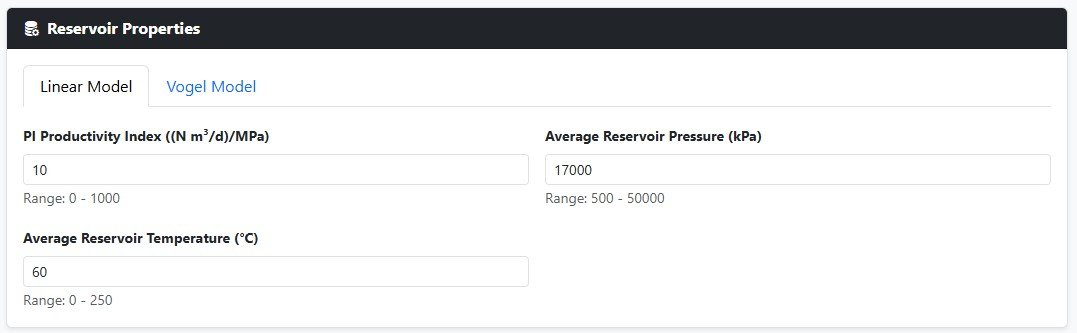
TapirFlow provides two IPR methods at this stage: Linear and Vogel. This tutorial uses the Linear model.
- Select Reservoir in the sidebar.
- Select the Linear Model tab.
- Enter PI Productivity Index. Use
10. - Enter Average Reservoir Temperature. Use
60. - Enter Average Reservoir Pressure. Use
17000.
SelectPlot Curve to view the Linear IPR curve.
You can also switch to the Vogel Model tab, enter the same required inputs used for the
Linear Model, and enter Maximum Oil Rate as 100. Select
Plot Curve again to view both IPR curves.
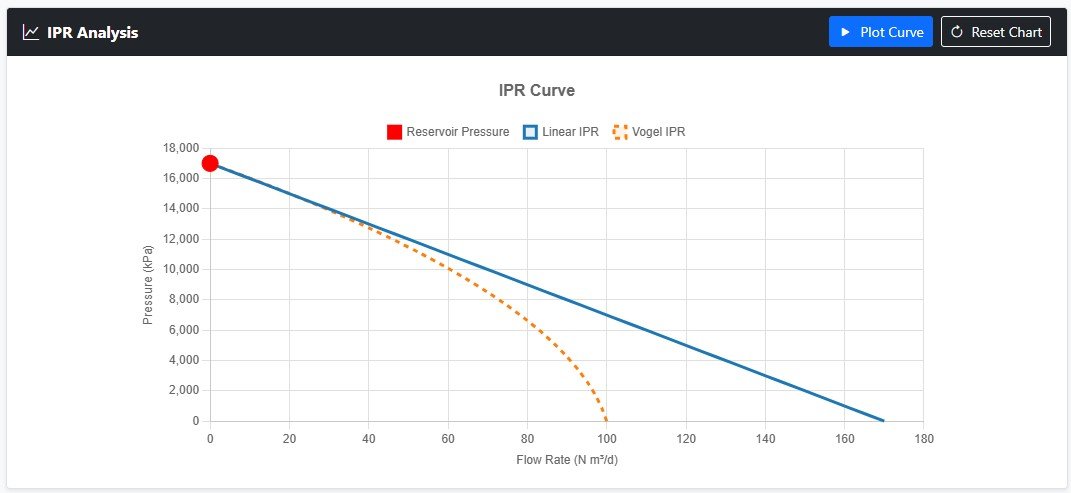
Return to the Linear Model tab and leave it active. The active tab is the model that will be used in the simulation.
4. Well Page - Enter Well Properties
- Select Well in the sidebar.
- Enter Rugosity. Use
0.05. - Enter Heat Coefficient. Use
30. - Under Casing Properties, enter ID. Use
150.4. -
Under Casing Properties, enter Bottom hole MD. Use
2000. - Under Tubing Geometry, enter Tub ID. Use
62. - Under Tubing Geometry, enter MD. Use
1700. - Under Tubing Geometry, enter TVD. Use
1700.
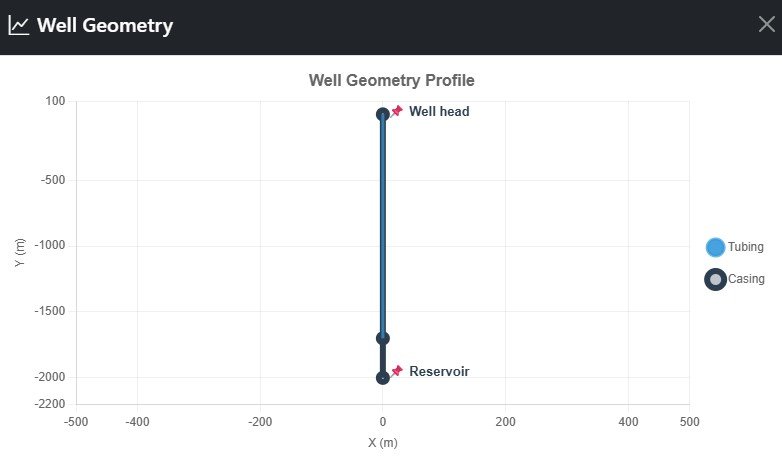
Because MD and TVD are equal, the well is vertical. The angle will be 90 degrees, measured from the horizontal line of the segment.
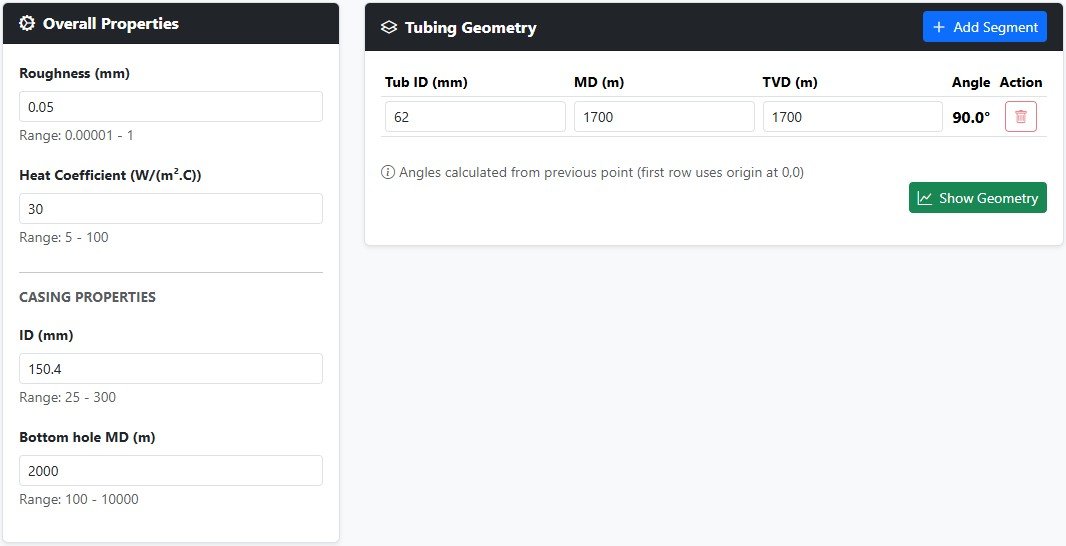
Select Show Geometry to view the well geometry.
5. Artificial Lift and Flowline Pages
- Select Art. Lift in the sidebar and verify that Incorporate artificial lift data into the simulation is unchecked.
- Select Flowline in the sidebar and verify that Incorporate flowline data into the simulation is unchecked.
6. Simulation Page - Enter Simulation Information
- Select Simulation in the sidebar.
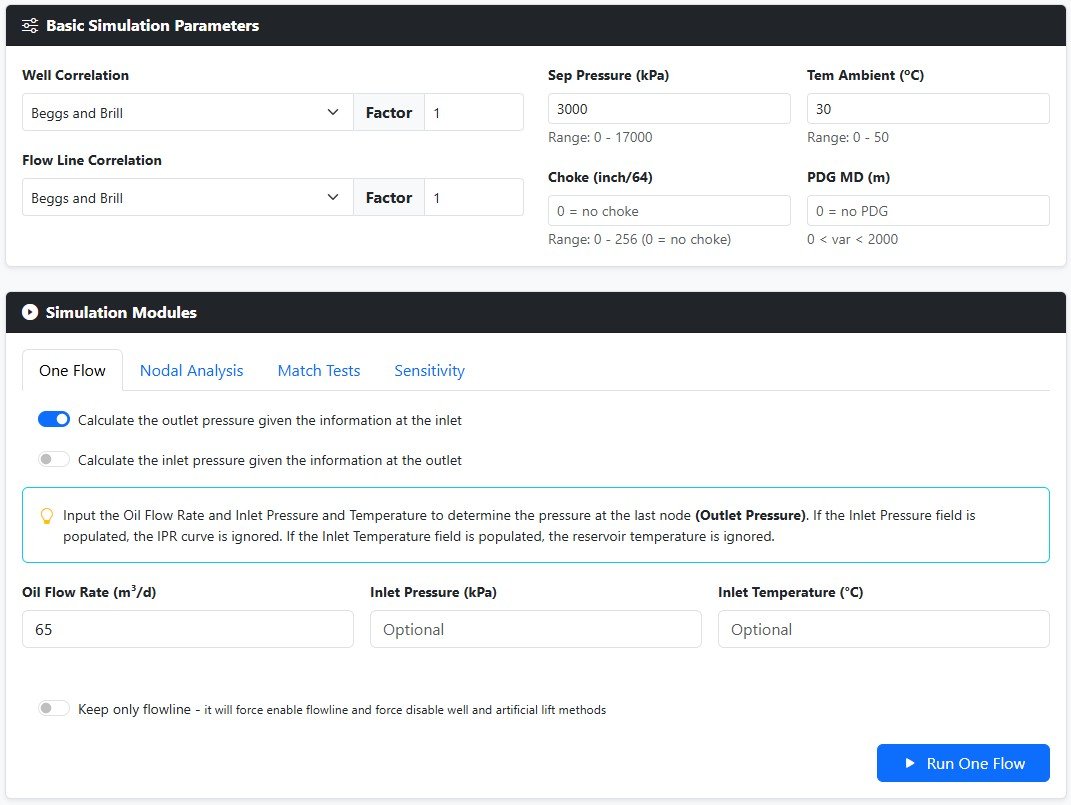
-
Select Well Correlation. Use
Beggs and Brill, and set the pressure-drop Factor to1.0. -
Select Flow Line Correlation. Use
Beggs and Brill, and set the pressure-drop Factor to1.0. - Enter Sep Pressure. Use
3000. - Enter Tem Ambient. Use
30. - Select the One Flow tab.
- Enter Oil Flow Rate. Use
65. - Leave Inlet Pressure and Inlet Temperature empty.
For a One Flow simulation, Sep Pressure is not directly used in the calculation if Calculate the outlet pressure given the information at the inlet is selected. It represents the pressure at the final node and becomes the main system constraint in other simulation types. Leaving them empty tells TapirFlow to use the IPR curve.
7. Settings Page
- Select Settings in the sidebar.
-
Verify that Discretization length is
100for both Well and Flowline.
8. Save and Upload the Model
Saving the model is a good practice because it prevents you from entering the same data again later.
Select Home, then select Save File. TapirFlow will save a file named
model_well_tutorial_1_oneflow_YYYYMMDD to your downloads folder.
Create a folder named Tutorials and move the saved file into it. To test the upload workflow, return to Home, select Clear All Data, then select Upload File and choose the saved file.
9. Run the One Flow Simulation
- Select Simulation in the sidebar.
- Select the One Flow tab.
- Select Run One Flow.
If everything is configured correctly, the simulation results will appear immediately below in the Stored Simulations table.
Click on View Results to switch to the Results page.
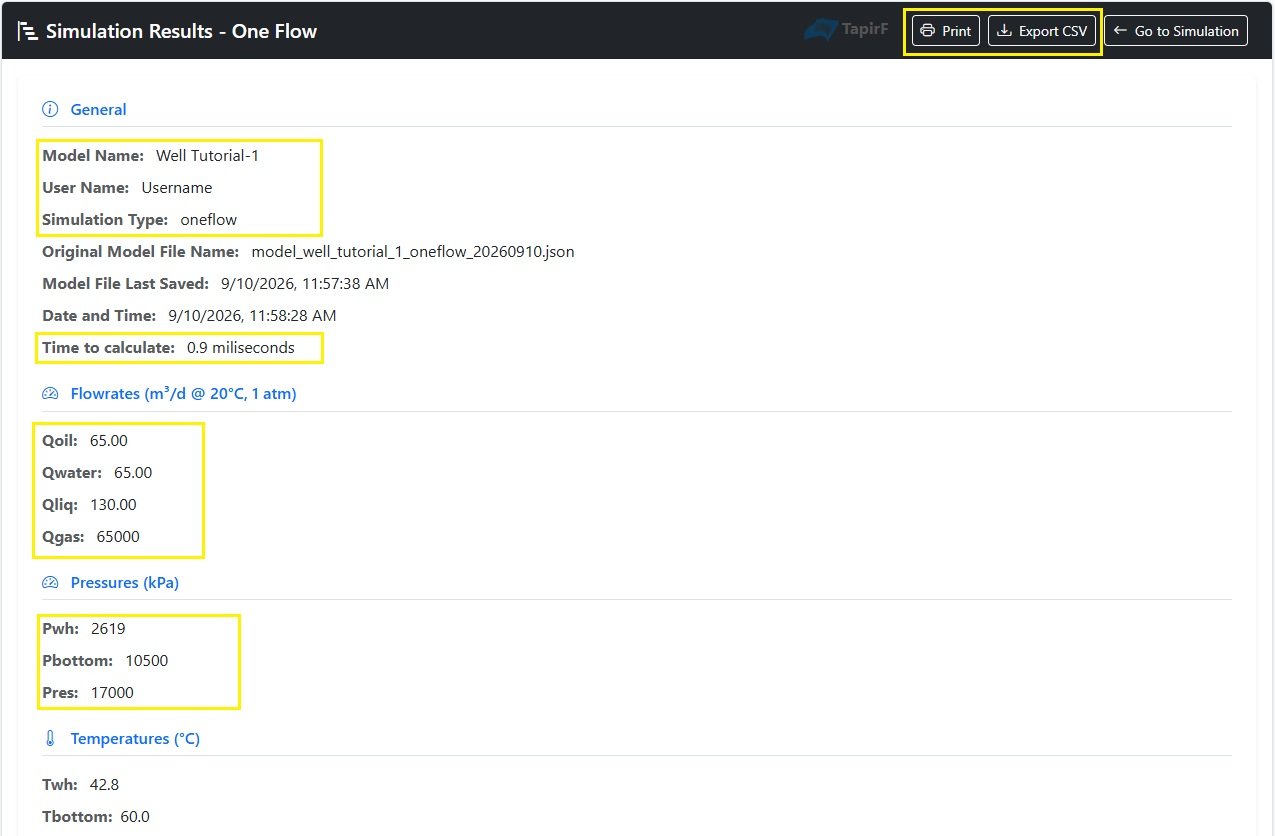
In the results page, review the following sections:
- General: model name, user name, simulation type, and calculation time.
- Flowrates: Qoil, Qwater, Qliq, and Qgas.
- Pressures: Pwh at the wellhead, Pbottom at the bottomhole, and Pres at the reservoir.
10. Review Result Plots
At the bottom of the Simulation Results page, select Plots to view the available plots.
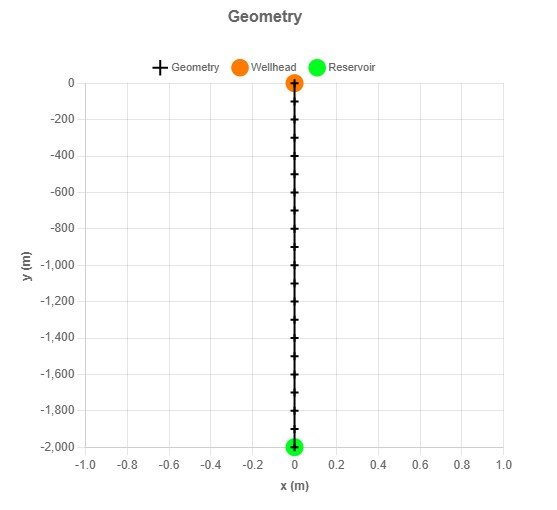
Geometry
The Geometry plot shows the discretized geometry.
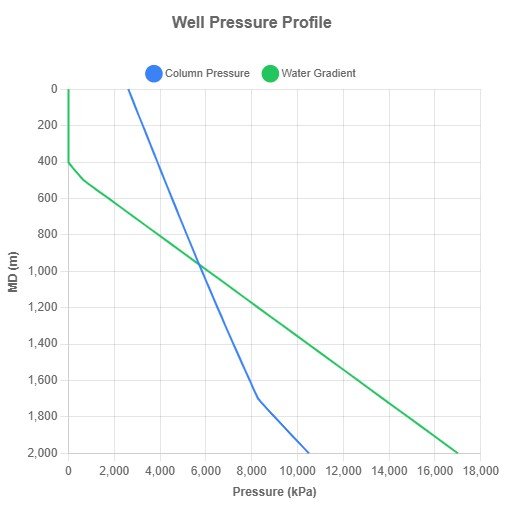
Pressure Profile for Well
The Pressure Profile for Well plot also provides an estimate of the static level using the water gradient. In this case, the static level is expected to be between 500 m and 400 m.
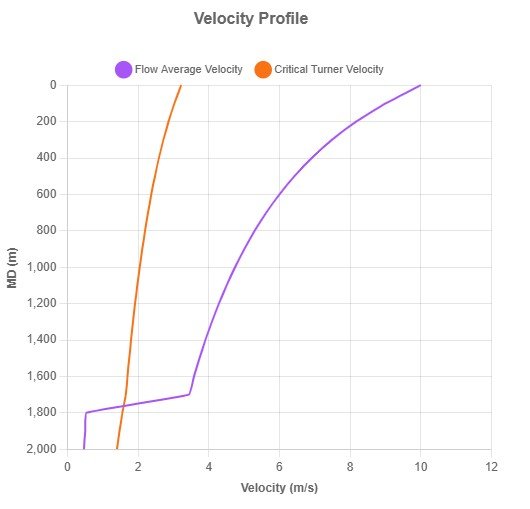
Velocity Profile for Well
The Velocity Profile for Well plot provides an estimate of the Turner critical velocity for liquid loading.
0.946 which brings Pwh to very close to the
target.